Spatial Analysis

Contents:
- Factors motivating Southern Transdanubian students' secondary education plans and career choices
- The economic effects of the COVID-19 pandemic amongst Hungarian enterprises – Changes in employee numbers
- International trends
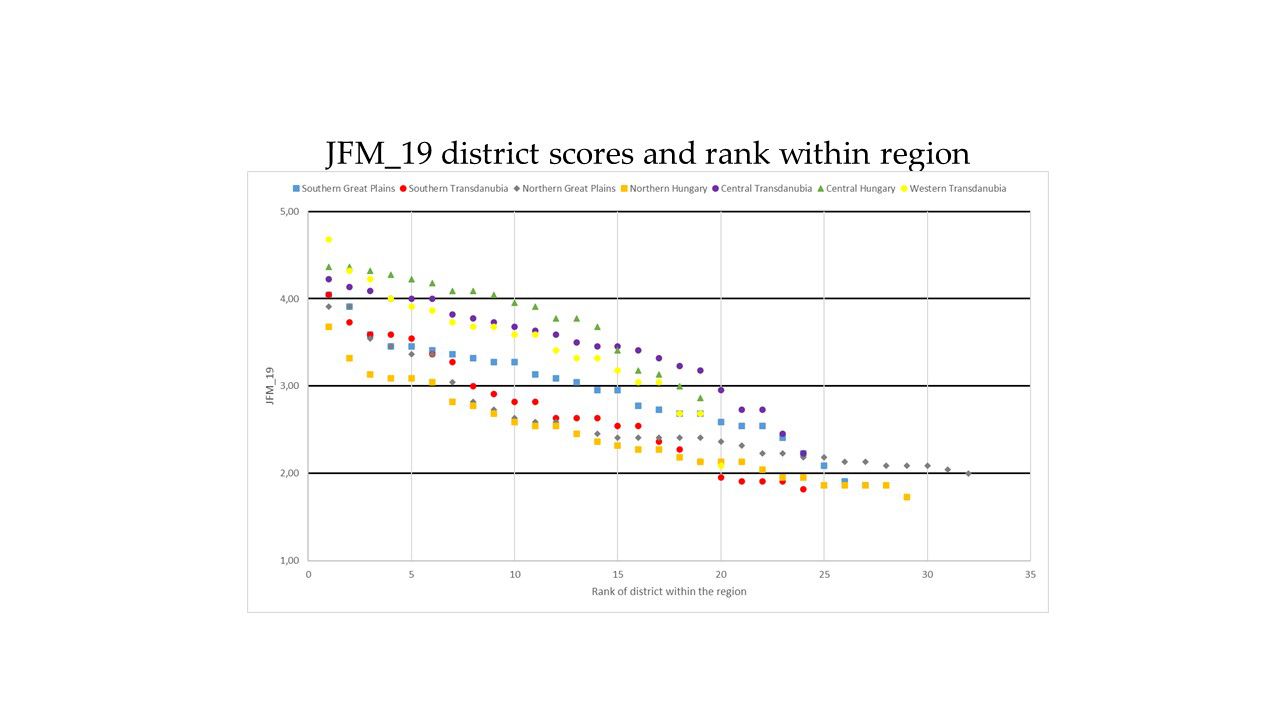
Based on the updated District Development Index (JFM_19) of HCCI IEER (MKIK GVI) we would like to give a better understanding of the development differences of the 174 Hungarian districts (járás). Unfortunately we cannot compare with the results of the previous studies since the Hungarian Central Statistical office (KSH) changed the methodology of some of the used measures and discontinued others.
Altogether the new index also indicates that the most developed districts almost exclusively are the capital and its agglomeration and of West and Central Transdanubia. It is quite interesting that according to the new calculation (JFM_19) Győr district has the highest development and is ahead of Budapest, which has worse business related and higher long term unemployment rates. Out of all the other (NUTS2) regions only the districts of bigger cities are in the top 25 (Kecskemét, Pécs, Debrecen, Nyíregyháza).
Read more >>>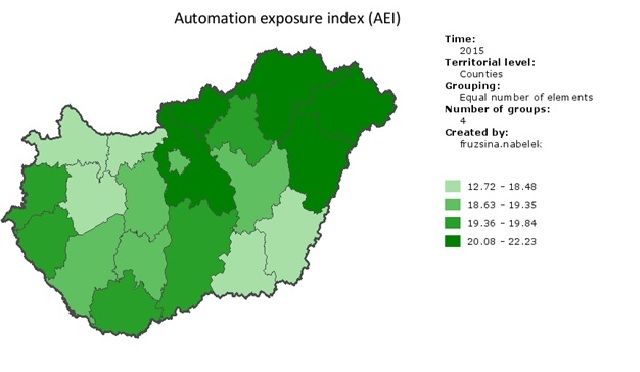
The new (digital) revolution generates significant changes in the labor market. The result of the ‘skilled-biased technological change’ suggests the following expectations: the demand for unskilled workers will decrease and the demand for high educated labor force will significantly increase. The full automation of certain professions will result in a decrease in the number of work places. In the IEER research the possible effects of automation on the Hungarian labor market were studied with a primary focus on the effects on districts and counties.
Read more >>>The newest values of HCCI IEER’s District Development Index (DDI) give us a new picture this year about development differences in the 174 districts of Hungary and highlight what changes have occurred in the course of the last two years.
The data shows that the most developed district outside of Budapest and its agglomeration can be found almost exclusively in Western and Central Transdanubia (Győr, Mosonmagyaróvár, Tata, Veszprém) and beside these only the districts of Szeged and Eger made it to the most developed top 20. The least developed districts are mostly in Northern Hungary and in the Northern Great Plains. Some of the districts in Transdanubia are also among the least developed (Tab, Barcs, Sárbogárd, Devecser) which indicates that among the regions of Hungary Transdanubia has the biggest internal disparities.
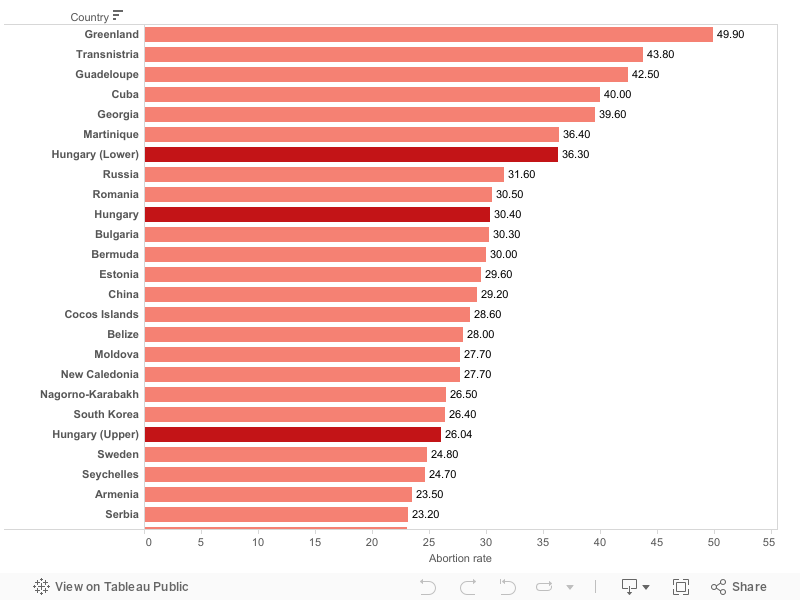
Read more >>>The idea for this study was provided by the social analysis of the differences between the white and non-white populations of the US in an article of The Economist. Below are shown some existing differences within Hungarian society regarding basic regional characteristic indicators, and based on these some graphs were drawn. We dubbed the 33 most disadvantaged micro-regions as "Lower-Hungary" and the most developed regions (11 in Budapest and the most advanced small rural areas) as "Upper-Hungary." We employed six indicators for the international comparison of the two types of Hungary: the abortion rate (i); infant mortality (ii) income per capita (iii), the number of motor vehicles (iv) the number of telephone lines (v) and average life expectancy at birth (vi).
The comparison of the data is designed to show the magnitude of the disparities between the regions of today's Hungary. In an international comparison, independent Upper-Hungary is in a better situation to a large extent than the national average. However, for several of the indicators the 33 most disadvantaged micro-regions of Lower-Hungary are far behind Upper-Hungary and the standards of developed countries.
Abortion rate
Abortions per 1,000 live births
Year:
2013 (Hungary: 2011)
Source:
http://www.johnstonsarchive.net/policy/abortion/wrjp335pd.html
http://www.johnstonsarchive.net/policy/abortion/hungary/ab-hungarysr2.html
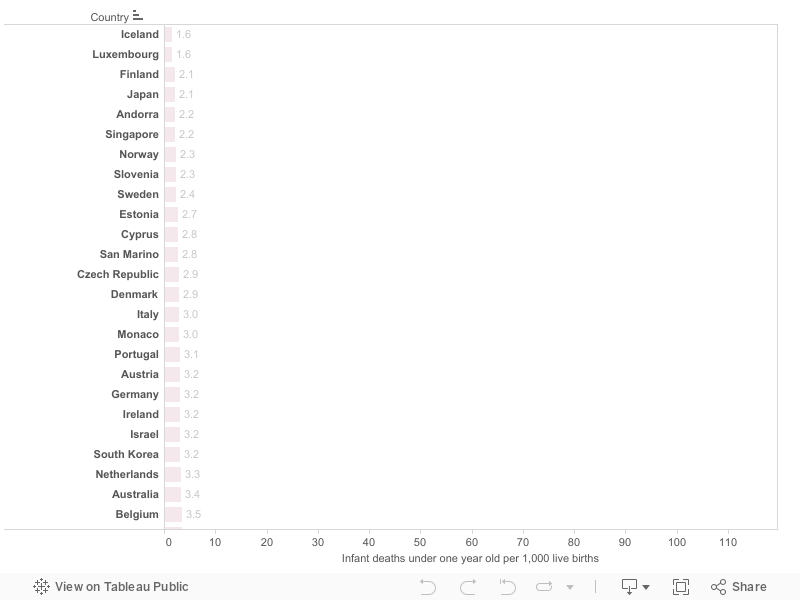
Infant mortality
Infant deaths under one year old per 1,000 live births
Year:
2012
Source:
http://data.worldbank.org/indicator/SP.DYN.IMRT.IN
http://www.regionaldata.org/hu_HU/territorial_data/
http://www.economist.com/blogs/graphicdetail/2015/04/daily-chart-16
Income per capita (USD)
Income per capita is gross domestic product in U.S. dollars divided by midyear population
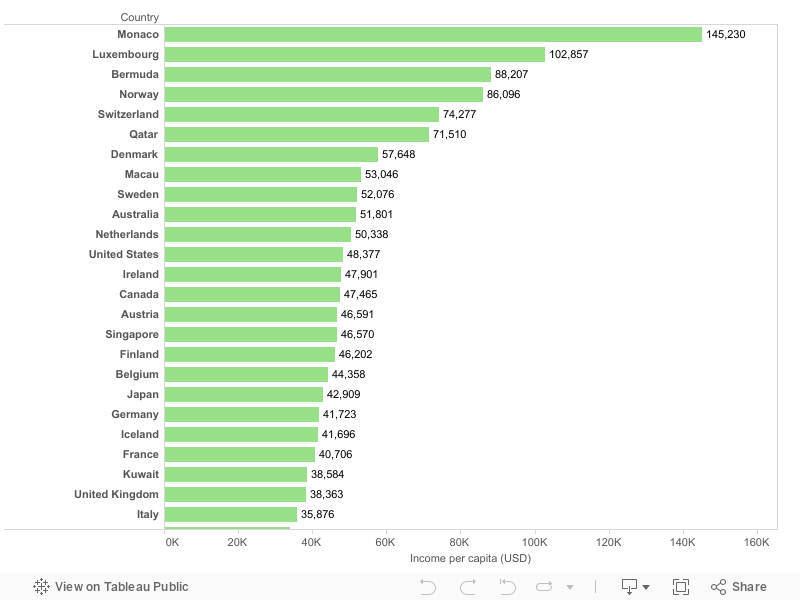
Year:
2010
Source:
http://data.worldbank.org/indicator/NY.GDP.PCAP.CD
http://www.regionaldata.org/hu_HU/territorial_data/
The number of motor vehicles
The number of road motor vehicles per 1000 inhabitants
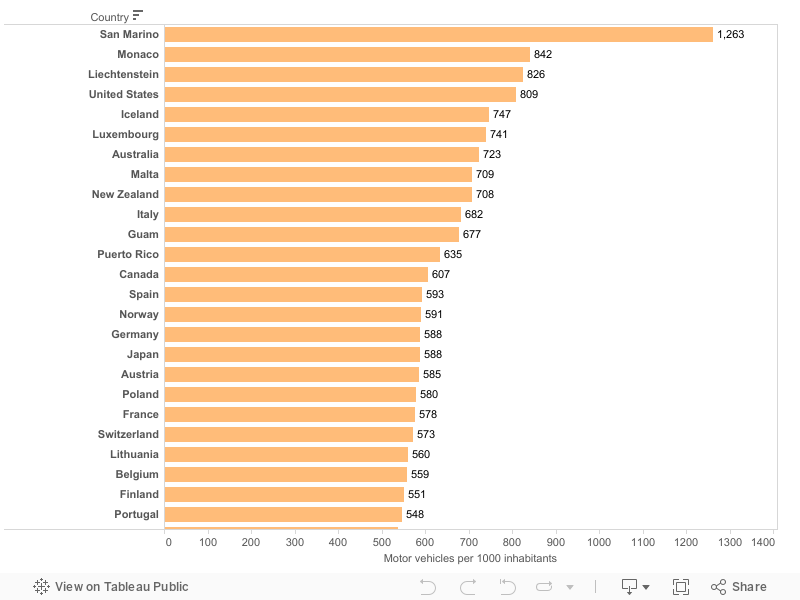
Year:
2008
Source:
http://data.worldbank.org/indicator/IS.VEH.NVEH.P3
http://www.regionaldata.org/hu_HU/territorial_data/
The number of telephone lines
Fixed telephone subscriptions per 100 people
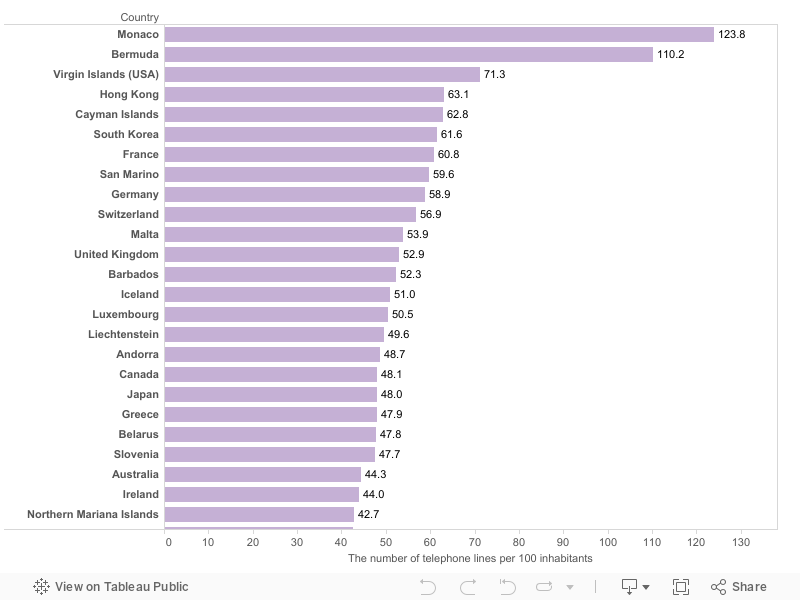
Year:
2013 (Hungary: 2012)
Source:
http://data.worldbank.org/indicator/IT.MLT.MAIN.P2
http://www.regionaldata.org/hu_HU/territorial_data/
Life expectancy at birth in years
Average life expectancy at birth in years for both sexes
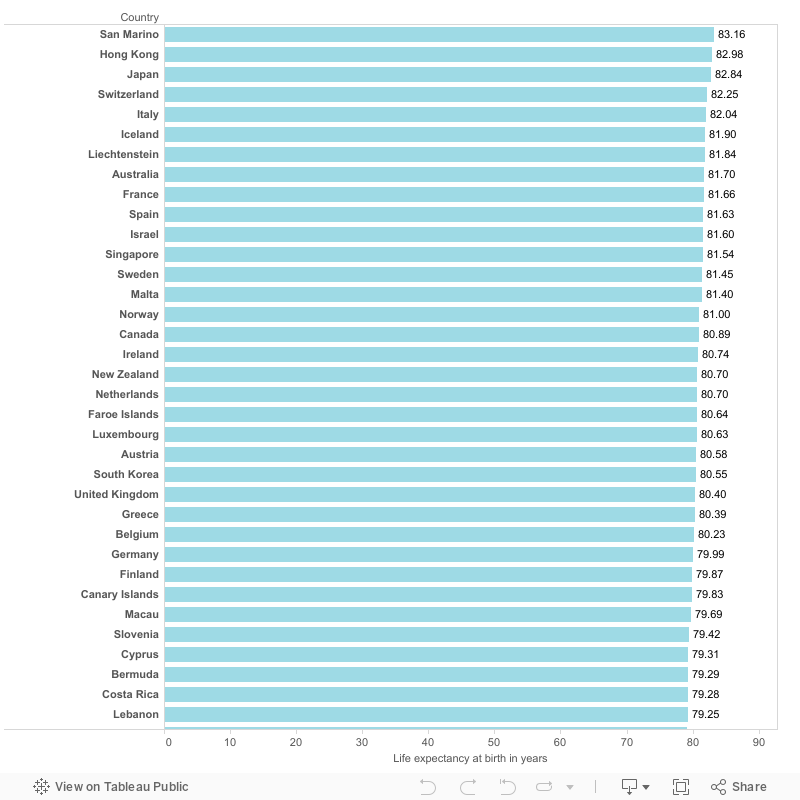
Year:
2010
Source:
data.worldbank.org/indicator/SP.DYN.LE00.IN
http://www.regionaldata.org/hu_HU/territorial_data/
http://www.economist.com/blogs/graphicdetail/2015/04/daily-chart-16
Read more >>>A previous GVI study examined the number of liquidation procedures of Hungarian companies in different parts of the country. The following figure illustrates this using the study's database to present a breakdown by county of the dynamics in the trend of liquidations by GDP per capita based on purchasing power parity in 2008, as well as regional changes in the launches of liquidation processes. The figure shows that in poorer areas of the country liquidations were more prevalent, but the increase in levels due to the financial crisis did not affect either poorer or richer areas specifically. The timeline on a regional level shows that the relationship between changes in the number liquidations and their geographical locations is not clear.
Read more >>>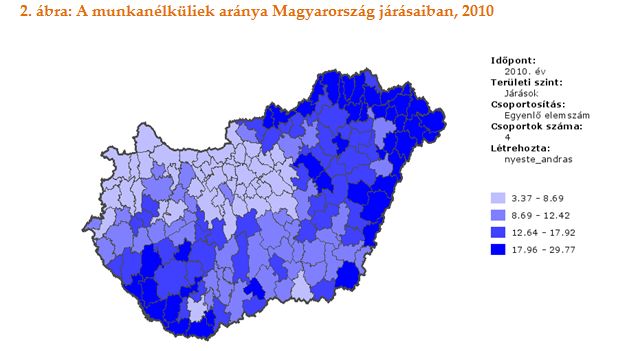
Social and economic developments after the regime change in 1989 have completely transformed our country. In many ways, Hungary was divided into two parts. The advanced, more developed area is increasingly linked to the more developed parts of the EU in all aspects and is an economically and socially emerging area, comprising of the capital city and its environs as well as the north-western part of the country. By contrast, all other parts of the country are increasingly separated from this developed region, and thus also the European average. To further awareness of this situation the HCCI IEER prepared the social and economic profiles of Hungary's regions in 2013 in which the development path of individual regions was clearly shown. In this analysis, based on the latest available data (2007-2012), the differences in the state of development of the 198 Hungarian statistical districts were examined. We present maps showing development on a statistical district scale. The analysis focuses on the regional differences of certain processes and phenomena, and provides an answer to the question of which are the most developed and most underdeveloped regions of our country.
Read more >>>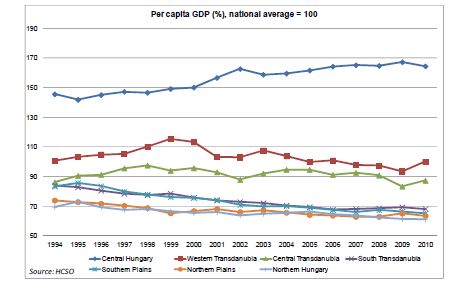
For the complete evaluation of the social and economic trends of the past 20 years, we should know more about the processes that took place after the transition and how these affected the regions of Hungary. What happened in a landscape, region or micro-region in the past 20-23 years. What changed about the job opportunities, income of the local people, how did the structure of the industry and agriculture change, catching up or falling behind characterize the local economies. The latest research paper of MKIK GVI (The socio-economic profiles of the Hungarian regions) provides basic information to anyone interested in these issues and uses the most important social and economic indicators to depict the socio-economic situation of the Hungarian regions and counties and their path in the development since the transition to the present.
On the following link an English summary of the paper can be downloaded.
Read more >>>
The aim of the research is to visualise and analyse trends in the economic development of Northern Hungary and to give an explanatory view on the actual economic situation of the region.
Read more >>>