January 2024 was the fifty-seven occasion of the IEER Quarterly Business Climate Survey. For this project a total of 350 companies (with at least 20 ... Open chart

The latest wave of the IEER Business Climate Survey is based on the responses of 1825 enterprises. According to the results the IEER Business Climate ... Open chart
According to the new results of the IEER Business Climate Survey (the survey is based on the responses of 1. 825 enterprises) the IEER Business Climate ... Open chart

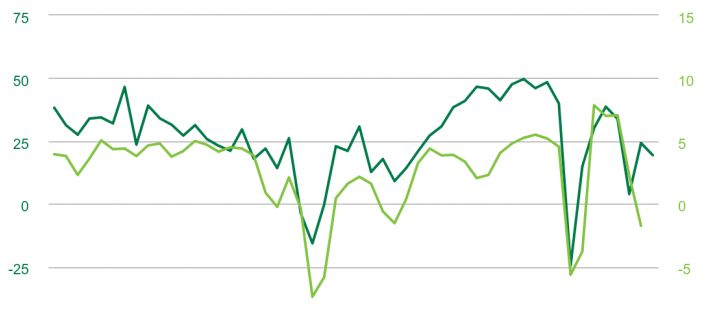
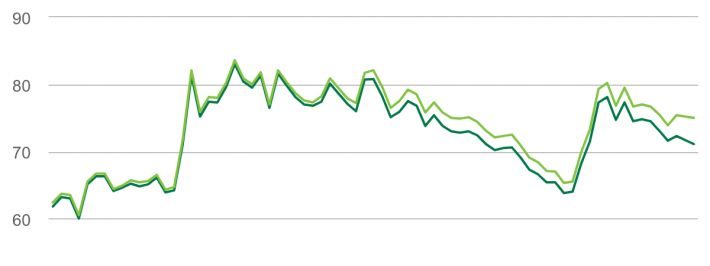
The figure illustrates the impact of the 2008 world financial crisis and the coronavirus epidemic in 2020 on the Hungarian and German economies compared ... Open chart
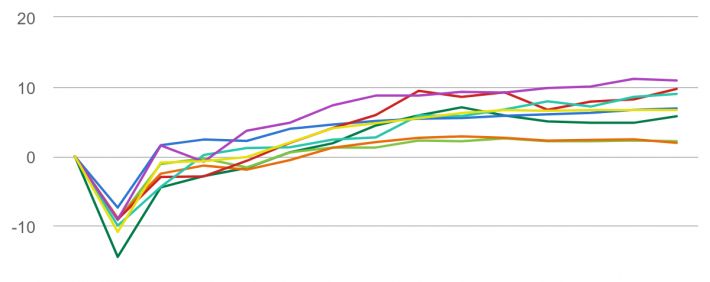
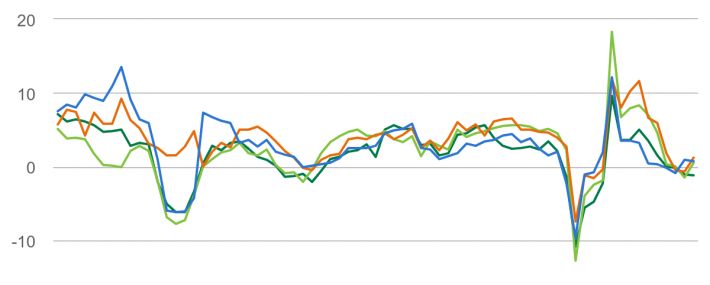
The figure illustrates the impact of the 2020 coronavirus epidemic on the Hungarian and other Central-Eastern European economies compared to each other. Open chart
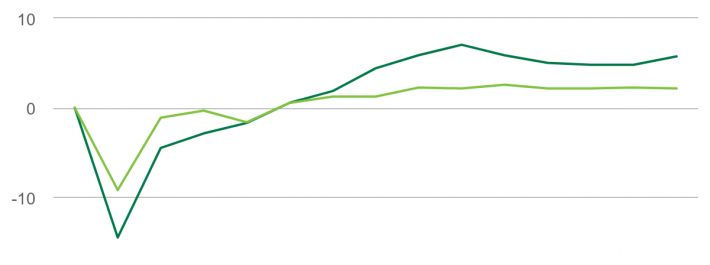
The figure illustrates the impact of the 2020 coronavirus epidemic on the Hungarian and German economies compared to each other. The quarterly change in ... Open chart

The figure illustrates the impact of the 2008 world financial crisis on the Hungarian and other Central-Eastern European economies compared to each other. Open chart

The figure illustrates the impact of the 2008 world financial crisis on the Hungarian and German economies compared to each other. The quarterly change in ... Open chart


The figure shows the 12 month log difference in trend restored leading indicator developed by OECD (12-month rate of change of the trend restored CLI - ... Open chart
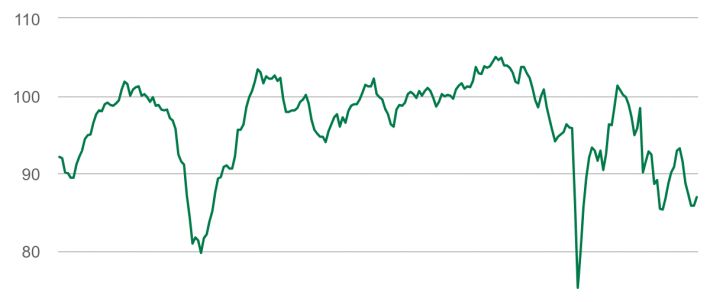
The ifo Business Climate Index is a widely observed early indicator for economic development in Germany. It is based on ca. 7. 000 monthly survey responses ... Open chart

The figure is based on the monthly Business Tendency Surveys of INSEE (French National Institute of Statistics and Economic Studies), and shows the ... Open chart
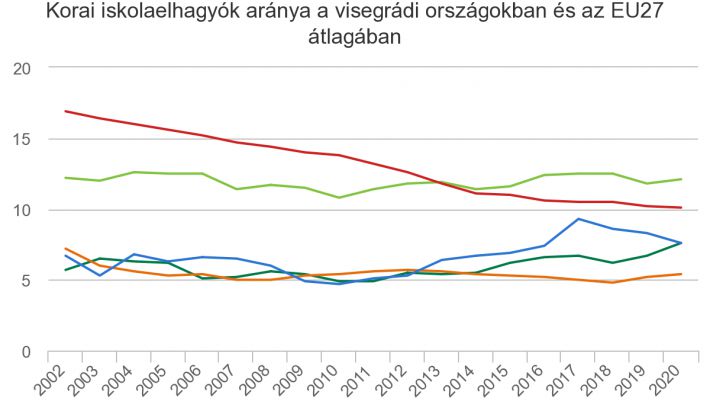
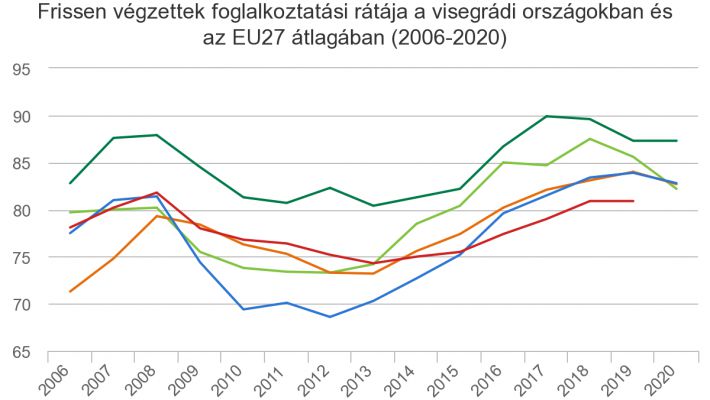
Reducing the share of early leavers from education and training is one of the specific objectives of the Europe 2020 strategy (target: below 10%). The ... Open chart